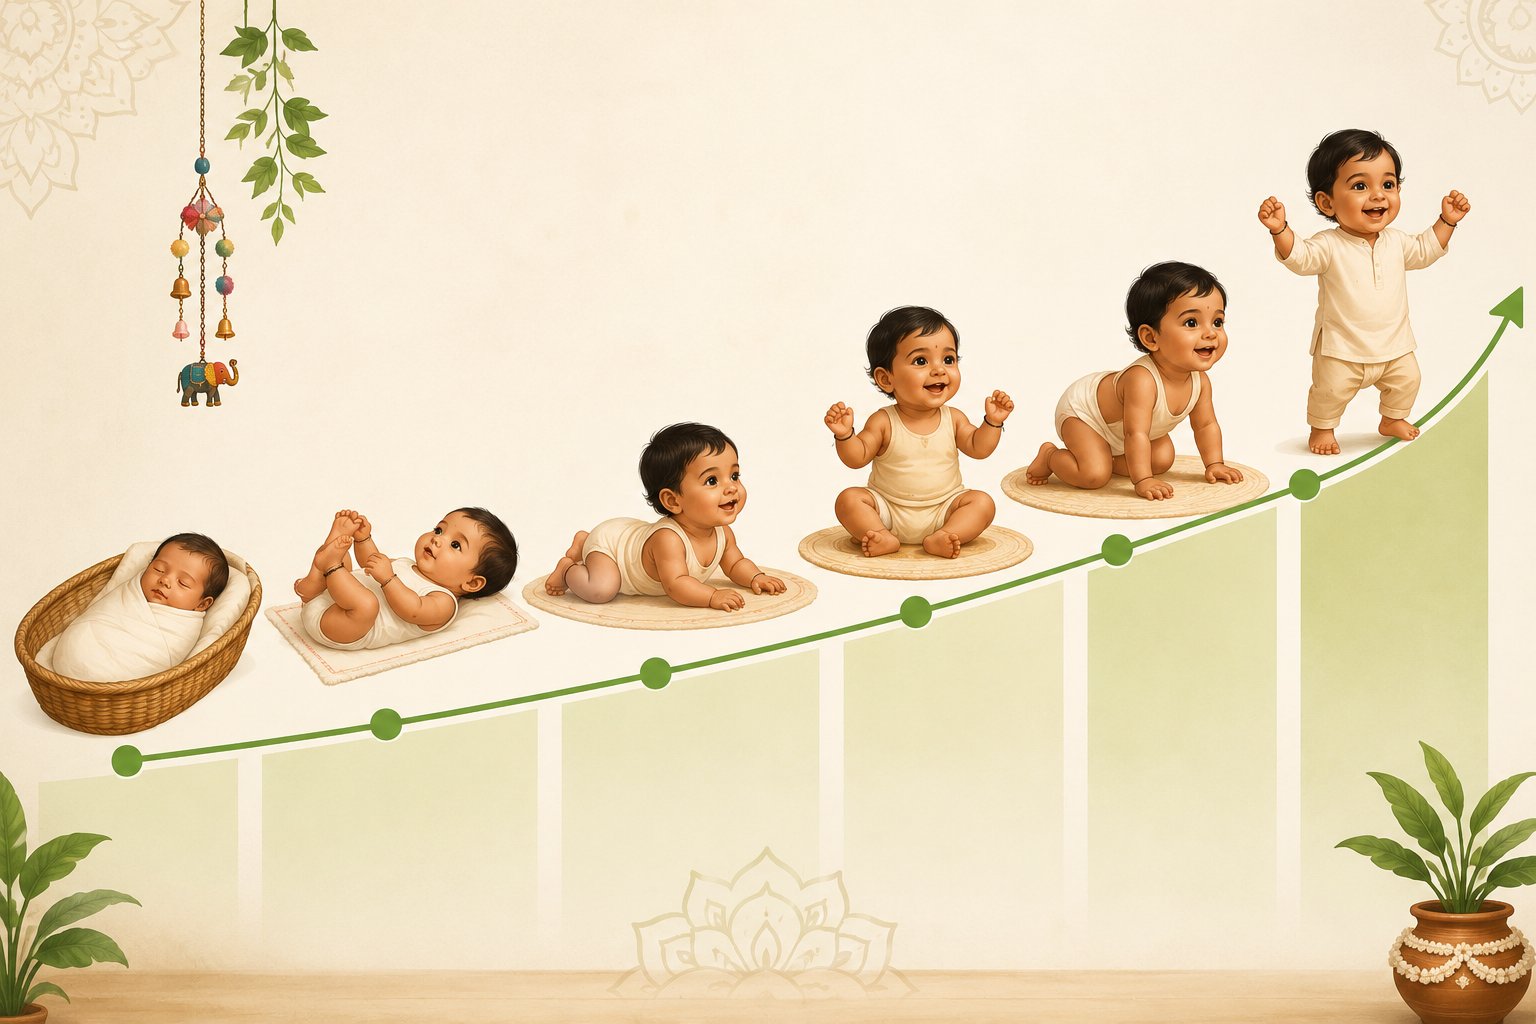
Weight is the most tracked number in a baby's first five years. Parents note it at every clinic visit. Grandparents ask about it. WhatsApp groups debate it. And yet the benchmarks that define "normal" weight for Indian babies are frequently drawn from studies of European or multi-ethnic Western populations — populations whose growth patterns differ meaningfully from South and East Asian children.
A major study by Chia et al. published in the Archives of Disease in Childhood (2023) specifically examined growth patterns across Asian racial groups — Chinese, Malay and Indian — and found significant differences not just from Western norms but between Asian ethnic groups themselves. Indian babies in the study were among the smallest at birth and tracked on a consistently lower weight trajectory through early childhood.
This matters enormously in practice. A healthy Indian baby tracking at the 10th percentile on a WHO chart — built on data including larger European and African children — may be labelled as underweight and subjected to unnecessary intervention. The same baby, plotted against Asian-specific norms, is entirely typical.
Baby weight chart — India reference ranges birth to 5 years
The table below draws on Asian cohort data and Indian population studies to give parents a more contextually accurate reference. These are approximate median weights and typical ranges — individual babies vary and should always be assessed by a paediatrician in context.
| Age | Boys — typical range (kg) | Girls — typical range (kg) | Key milestone |
|---|---|---|---|
| Birth | 2.5 – 3.5 kg | 2.4 – 3.3 kg | Birth weight established |
| 1 month | 3.4 – 4.8 kg | 3.2 – 4.5 kg | Regains birth weight, begins gaining |
| 2 months | 4.3 – 5.9 kg | 3.9 – 5.4 kg | Rapid gain phase |
| 3 months | 5.0 – 6.9 kg | 4.6 – 6.3 kg | ~150–200g/week gain typical |
| 4 months | 5.6 – 7.6 kg | 5.1 – 7.0 kg | Gain begins to slow slightly |
| 6 months | 6.4 – 8.8 kg | 5.9 – 8.2 kg | Approximately double birth weight |
| 9 months | 7.2 – 10.0 kg | 6.6 – 9.3 kg | Complementary feeding well established |
| 12 months | 7.8 – 10.8 kg | 7.1 – 10.1 kg | ~3× birth weight by first birthday |
| 18 months | 8.8 – 12.3 kg | 8.1 – 11.5 kg | Growth rate slows; appetite may dip |
| 2 years | 9.7 – 13.7 kg | 9.0 – 12.9 kg | ~4× birth weight by age 2 |
| 3 years | 11.3 – 16.2 kg | 10.8 – 15.8 kg | Steady ~2 kg/year gain |
| 4 years | 13.0 – 18.5 kg | 12.3 – 18.2 kg | Consistent pattern established |
| 5 years | 14.5 – 21.0 kg | 13.7 – 20.5 kg | School-age growth pattern begins |
These ranges reflect approximately the 3rd to 97th percentile for Indian children. A baby consistently below the 3rd percentile, or showing a significant drop across percentile lines over time, warrants paediatric review — not because a single reading is alarming, but because the trend matters more than any single number.
What the chart doesn't tell you — and what matters more
Weight in isolation is a limited metric. A baby can be at the 5th percentile and be thriving — alert, active, feeding well, meeting developmental milestones. A baby at the 50th percentile can be missing motor milestones and showing reduced social responsiveness. The number on the scale is one data point, not a verdict.
"Indian babies naturally track lower on WHO weight charts. A healthy Indian baby at the 10th percentile is not underweight — they are Indian."
What paediatricians actually look for is the trajectory — is the baby following their own growth curve consistently? A baby who drops from the 25th to the 5th percentile over three months is more concerning than one who has always been at the 5th. Crossing lines downward warrants investigation. Sitting steadily at a low percentile usually does not.
Beyond weight, developmental progress across motor, communication, social and cognitive domains gives a far richer picture of a child's wellbeing. A baby who is small but hitting milestones, engaging actively with caregivers, and eating a varied diet is almost certainly thriving.
Be in Charge
Growth and nutrition differences can be quiet — often hidden in everyday moments. Knowing how your child is developing early gives you more opportunity to support them.
Know today, through your child's RBSK developmental markers. Objective, from home, in 6 minutes.
When to be concerned — and when to breathe
Worth monitoring closely: Baby drops more than two major percentile lines between visits. Baby is below the 3rd percentile and showing reduced activity, feeding difficulties or developmental delays. Baby was tracking well and suddenly plateaus or loses weight without illness.
Usually not a concern: Baby is at a low percentile but has always been there and is growing consistently. Baby is smaller than cousins or peers — family size matters, and Indian babies naturally run smaller. Baby had a slow week during illness and then caught up.
Talk to your paediatrician if: You have any persistent concern about growth. Feeding is difficult or painful. Baby seems uninterested in food for extended periods. Baby is losing skills or becoming less interactive alongside weight concerns.
Weight worry is one of the most common sources of parental anxiety in the first five years — and much of it is driven by charts that weren't designed for Indian babies. The most useful thing you can do is track consistently, note the trend, and bring questions to your paediatrician with data rather than worry.
And if you want to understand your child's full developmental picture — beyond just weight — that's exactly what a structured developmental profile is for.
Based on: Chia M et al. Growth charts for Asian children: a multiracial Singapore cohort. Archives of Disease in Childhood. 2023. | WHO Child Growth Standards. who.int/tools/child-growth-standards. | Indian Academy of Pediatrics Growth Charts. Indian Pediatrics. 2015;52(1):47–55.